|
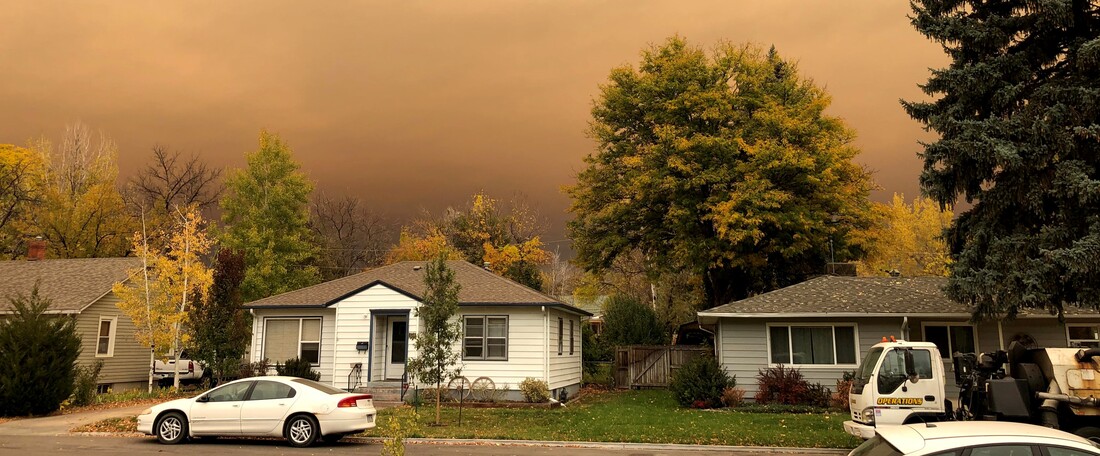
Troy Wixson Third year PhD student The three largest wildfires in Colorado occurred in 2020 and all 20 of the largest wildfires in Colorado were after 2000. Are wildfire seasons like 2020 more likely now than they used to be? We used novel statistical methods to quantify the increase in risk when compared to roughly 50 years ago. Most of statistics focuses on averages but it would be unreasonable to expect these methods to capture extreme behavior well. Our study uses extreme value theory which focuses on these rare but impactful events. Wildfire risk is greatest during high winds after sustained periods of dry and hot conditions and thus it is a seasonal concern. To understand how risk progresses throughout the season we modeled the lagged tail dependence (i.e. how much does our knowledge about tomorrow's risk change if we know that today was a high-risk day?). Our method was applied to the Grand Lake area of Colorado using weather station data and reanalysis data (a combination of climate model output and global weather observations). We found that the extreme weather on the days with the highest risk is more extreme under current climate than it was under the climate of 50 years ago. This upward shift in the risk on the worst days mirrors an increase in the hottest observed temperatures when compared to temperatures from 50 years ago. According to our method applied to reanalysis data the risk of a season at least as bad as 2020 is between four and ten times what it was 50 years ago. When using weather station data, our method finds that a season as extreme as 2020 was not possible 50 years ago. We also applied our method to the Quincy area of California using reanalysis data and 2021 as the reference year. This analysis suggested that the worst wildfire risk persists for more of the season than it did 50 years ago but there was not enough evidence to confidently say that seasons as bad as 2021 are more likely now than they were 50 years ago. We think this may be because the risk index we used (FWI) is not the best index when considering California wildfires.
0 Comments
Are susceptible periods of exposure to air pollution during pregnancy the same for everyone?3/5/2023 Danielle DemateisThird year PhD student in statistics Exposure to air pollution during susceptible time periods in pregnancy has been linked to low birth weight, which is a known risk factor for health problems later in life. While this link is well established in the scientific community, it is not yet clear whether susceptible time periods change based on maternal characteristics (e.g. stress level, socio-economic status (SES), or body mass index) or neighborhood level factors (e.g. characteristics of a mother’s community).
I am developing a new model that allows me to determine different susceptible time periods of exposure based on a neighborhood level factor. One factor that I think may be interesting is an indicator of collective health and social vulnerabilities in a mother’s community. The Colorado EnviroScreen project has created such an indicator for every census tract in Colorado. I am using my newly developed model to see how this indicator plays a role in the effect of air pollution on birth weight. |
AuthorWe are graduate students at Colorado State University conducting statistics research. ArchivesCategories |

 RSS Feed
